Barriers to Safe Access
Slate Quarry Rd, Clinton, New York
Vehicle crashes are a leading cause of death across the world, in our country, state, and here in Dutchess County. We hear about crashes so often that they seem inevitable. But crashes are not inevitable—they are often predictable and almost always preventable. And behind every crash is a mother or father, sister or brother, daughter or son; a friend; a neighbor; a classmate or colleague. Understanding the patterns behind where crashes happen and why they happen can help us prevent them.
In 2026, we completed a Transportation Safety Action Plan (SAP) to better understand crash patterns across the county and identify actions to reduce crashes and provide safer access for all types of transportation.
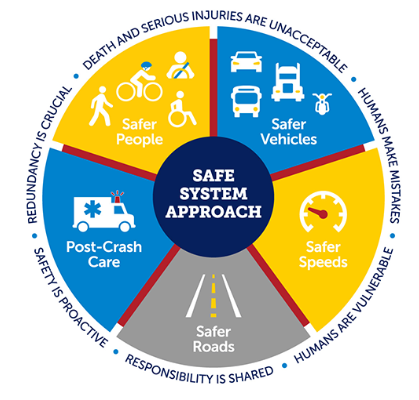
The SAP embraces the Safe System Approach, which recognizes that humans make mistakes and focuses on reducing the impact of those mistakes. A Safe System provides overlapping layers of safety to prevent crashes and reduce the harm caused when crashes do occur. These include safer roads, safer people, safer speeds, safer vehicles, and post-crash care.
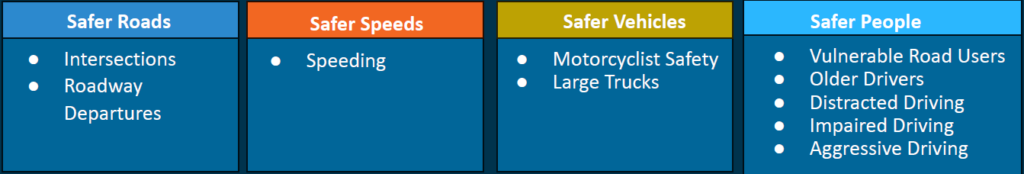
The SAP focuses on ten Emphasis Areas, based on a detailed analysis of crash data and public engagement: intersections, roadway departures, speeding, motorcyclist safety, large trucks, vulnerable road users, older drivers, distracted driving, impaired driving, and aggressive driving. It outlines actions to address crashes in each of these areas.
Reactive & Proactive Approaches
The SAP evaluates crashes in two ways:
- The Hotspot Screening identifies a set of locations with a history of fatal and serious injury crashes and the greatest potential for safety improvements. These hotspots are based on data analysis and feedback from road owners. They include State, County, and local segments and intersections, with at least one locally owned location in each municipality. In municipalities with few fatal and serious injury crashes, local officials identified a location based on local safety concerns.
- The Systemic Screening focuses on four priority crash types: roadway departures, speeding, intersection crashes, and pedestrian crashes. It identifies locations with the highest future risk of severe crashes, based on the road or intersection’s characteristics. These are locations where proactive, low-cost countermeasures can be applied.
Together, the overall screening analyses support a data-driven approach for road owners to prioritize and implement safety improvements, both reacting to crash patterns, and taking proactive steps to prevent crashes from happening.
Our methodology document (.pdf) describes the details of this analysis, and our Barriers to Safe Access map shows the results.
SAFETY ACTION PLAN GOALS
Our Safety Action Plan establishes three goals for 2050:
- Zero traffic fatalities
- A 50% reduction in serious injuries
- A 50% reduction in fatalities and serious injuries for pedestrians and bicyclists
Where are our crash hotspots?
Intersection hotspots are concentrated in southwest Dutchess, though there are some in other areas. The City of Poughkeepsie has the most locations (nine), followed by the Town of Poughkeepsie (three). There are 20 intersection hotspots on State roads, nine on County roads, and nine on local roads.
Segment hotspots are distributed across the county, but there are more in western Dutchess. The City of Poughkeepsie has the most locations (12), followed by the Town of Poughkeepsie (seven) and Town of Hyde Park (six). There are 20 segment hotspots on State roads, six on County roads, and 44 on local roads.
Traffic Fatalities in Dutchess (1979-2021)
Source: Dutchess County Safety Action Plan
Serious Injuries in Dutchess (2017-2023)
Source: Dutchess County Safety Action Plan
Non-Motorized Fatalities & Serious Injuries
Source: Dutchess County Safety Action Plan
Where are our systemic crash risks?
Roadway Departure Crashes
NYSDOT defines roadway departure crashes as head-on and sideswipe crashes as well as crashes with various roadside elements (e.g., ditches, light/utility poles, guiderail, signposts, trees and other fixed objects).
Preventing roadway departure crashes has become a high priority across the country, including in New York State, since they represent a large portion of fatal and serious injury crashes, despite being less common than some other crash types. In Dutchess County, roadway departure crashes account for more than 20 percent of fatal and serious injury crashes, though they only represent 12 percent of total crashes.
Based on the systemic analysis, the most common locations for roadway departure crashes are arterials and major collectors. Some examples of high-risk segments for roadway departure crashes include portions of Salt Point Turnpike (Route 115/CR 17) in Pleasant Valley/Clinton, Haviland Rd in Hyde Park, and Overlook Rd (CR 46) in LaGrange.
Traffic risk is greatest on major roads with higher speed limits and significant traffic. More than half of fatalities and serious injuries occur on these major roads, though they make up less than 20 percent of centerline miles in Dutchess.
When focusing on crashes that resulted in a fatality or serious injury, right-angle collisions had the highest share (32%), followed by rear-end (23%) and head-on (21%) collisions.
Speed-related Crashes
Speeding directly increases the likelihood of a crash and the risk of fatal and serious injuries when a crash occurs. In Dutchess County, crashes involving unsafe speeds account for more than 20 percent of all fatal and serious injury crashes. Speed is likely a factor in other crashes as well, but the responding officer doesn’t always know if speed was involved, or may cite more severe contributing factors.
We know that drivers tend to drive at the speed that feels comfortable given the design of a road. However, road elevations and curves, weather and pavement conditions, and surrounding land uses can change along a roadway, and drivers don’t always respond appropriately. For example, many of our roads have sections with curves, narrow shoulders, and adjacent trees, culverts, or other objects. Rain or snow can make roads slippery. And our roads often travel through hamlets in between stretches of less-developed land. All these factors should cause drivers to reduce their speed, but some unfortunately don’t.
Based on the systemic analysis, the most common locations for speed-related crashes are arterials and major collectors. Some examples of high-risk segments for speed-related crashes include portions of Route 9G in Red Hook, Route 199 in Pine Plains/North East, and North Quaker Lane (CR 16) in Hyde Park.
Intersection Crashes
In both New York State and Dutchess County, intersection-related crashes are the most common crash type. In Dutchess County, intersection-related crashes represent almost half of all fatal and serious injury crashes.
Based on the systemic analysis, the most common locations for intersection-related crashes are urban signalized intersections with four legs (“cross” intersections) or five or more legs; urban signalized Y and T intersections; and rural stop-controlled “cross” intersections.
Some examples of high-risk intersections include locations along Route 44/55 in Poughkeepsie, Route 9 in the Village of Wappingers Falls and Village of Fishkill, and Route 9D in Beacon.
Pedestrian Crashes
Pedestrians are more vulnerable than other roadway users, so crashes involving pedestrians often result in serious injury or death. In Dutchess County, pedestrian-related crashes accounted for one percent of all crashes, but more than three percent of all fatal and serious injury crashes.
Based on the systemic analysis, the most common locations for pedestrian-related crashes are urban signalized intersections with four legs (“cross” intersections); urban signalized Y and T intersections; and urban stop-controlled “cross” intersections.
Design factors such as intersections with multiple turning conflicts, streets with long distances between crossings, and commercial corridors with many driveways can create conflicts between vehicles and people walking.
Some examples of high-risk intersections for pedestrian crashes include locations along Main St and Route 44/55 in Poughkeepsie, Route 9D and Main St in Beacon, and Route 9D in Wappingers Falls.
What is being done?
Several of the high-crash or high-risk locations have been evaluated through planning studies and in some cases, improvements are planned or have been implemented.
Relevant studies include our Poughkeepsie 9.44.55 study and Columbus Drive Redesign; our village and town center Pedestrian Plans; our City of Poughkeepsie Speed Limit Reduction Study; and our Safety Assessments (see sidebar).
In addition, since 2016, we have analyzed speed patterns on County and local roads based on data from our traffic count program in our annual high-end speeding reports. These analyses highlight road segments where at least 15% of drivers exceed the posted speed limit by more than ten miles per hour. However, our analyses assume that the posted speed limit is appropriate given the road geometry and surrounding context – which suggests that we should evaluate speed limits considering these factors and identify corridors or segments where lower speed limits should be explored.
What We Heard
“I wish it was easier for my kids to bike around the neighborhood and visit friends, but I don’t feel like some of the roads around us are safe.” – Moving Dutchess Forward survey
Our Role
Based on our Safety Action Plan, our role could include the following:
- Work with State, County, and local road owners to plan and implement projects based on the Safety Action Plan’s findings and recommendations.
- Support behavioral programs and policies to address key issues including distraction, aggressive driving, older drivers, and post-crash care.
- Review and consider updates to the County’s Complete Streets Policy.
- Support local speed management policies.
- Enhance our Project Selection Framework to incorporate Safe Systems principles.
- Seek financial support for safety initiatives from Governor’s Traffic Safety Committee (GTSC).
- Support and expand our Watch Out For Me campaign.
- Continue our safety assessments in partnership with road owners, focusing on crash hotspots or systemic locations, and incorporating walking and bicycling safety.
- Continue our high-end speeding evaluations and work with County Public Works and municipalities to evaluate speed limits and identify locations where lower speed limits should be considered.
SAFETY ASSESSMENTS
We perform safety assessments to take a detailed look at a high-crash corridor, segment, or intersection. We start by assembling a multi-disciplinary team, typically including County Public Works’ engineering and maintenance staff; State, County or local law enforcement; local highway staff; and a local elected official, in addition to our own staff.
The team holds a pre-assessment meeting to review crash data, traffic volume and speed data, maintenance records, and plans, conducts a site visit to observe and document issues and discuss possible solutions, and then holds a post-assessment meeting to review the observations and possible solutions and agree on recommendations.
We then produce a formal report outlining the recommendations and a general timeframe for implementing them. See our publications page for Safety Assessment reports.