Housing Trends
Eastdale Village, Poughkeepsie, New York
Trends in housing – whether related to affordability, availability, or type – affect how our county’s population will change. For most of us, our trips for the day start and end at home. Where we choose to live, or can afford to live, is essential when trying to understand our transportation needs. To understand how housing trends might affect our future transportation system, we sought to answer two basic questions:
- What are the current trends in the county’s housing stock and prices?
- How do we expect these housing dynamics to change in the future?
We reviewed data from various sources, including Dutchess County Planning’s Housing Needs Assessment (2022), For-Sale Housing Report, and Rental Housing Survey, to understand how housing changes will impact our transportation system. Below is a summary of those key trends, their implications, and ideas on how we might address them.
What We Heard
“I live in a dense and compact neighborhood whose development far pre-dates the automobile. It is within walking distance of my job and most daily activities. The density and walking allow me to get to know my neighbors in a way that large-lot single family neighborhoods would make challenging.”– Moving Dutchess Forward survey
Trend 1. The detached single-family home will continue to make up much of our housing stock
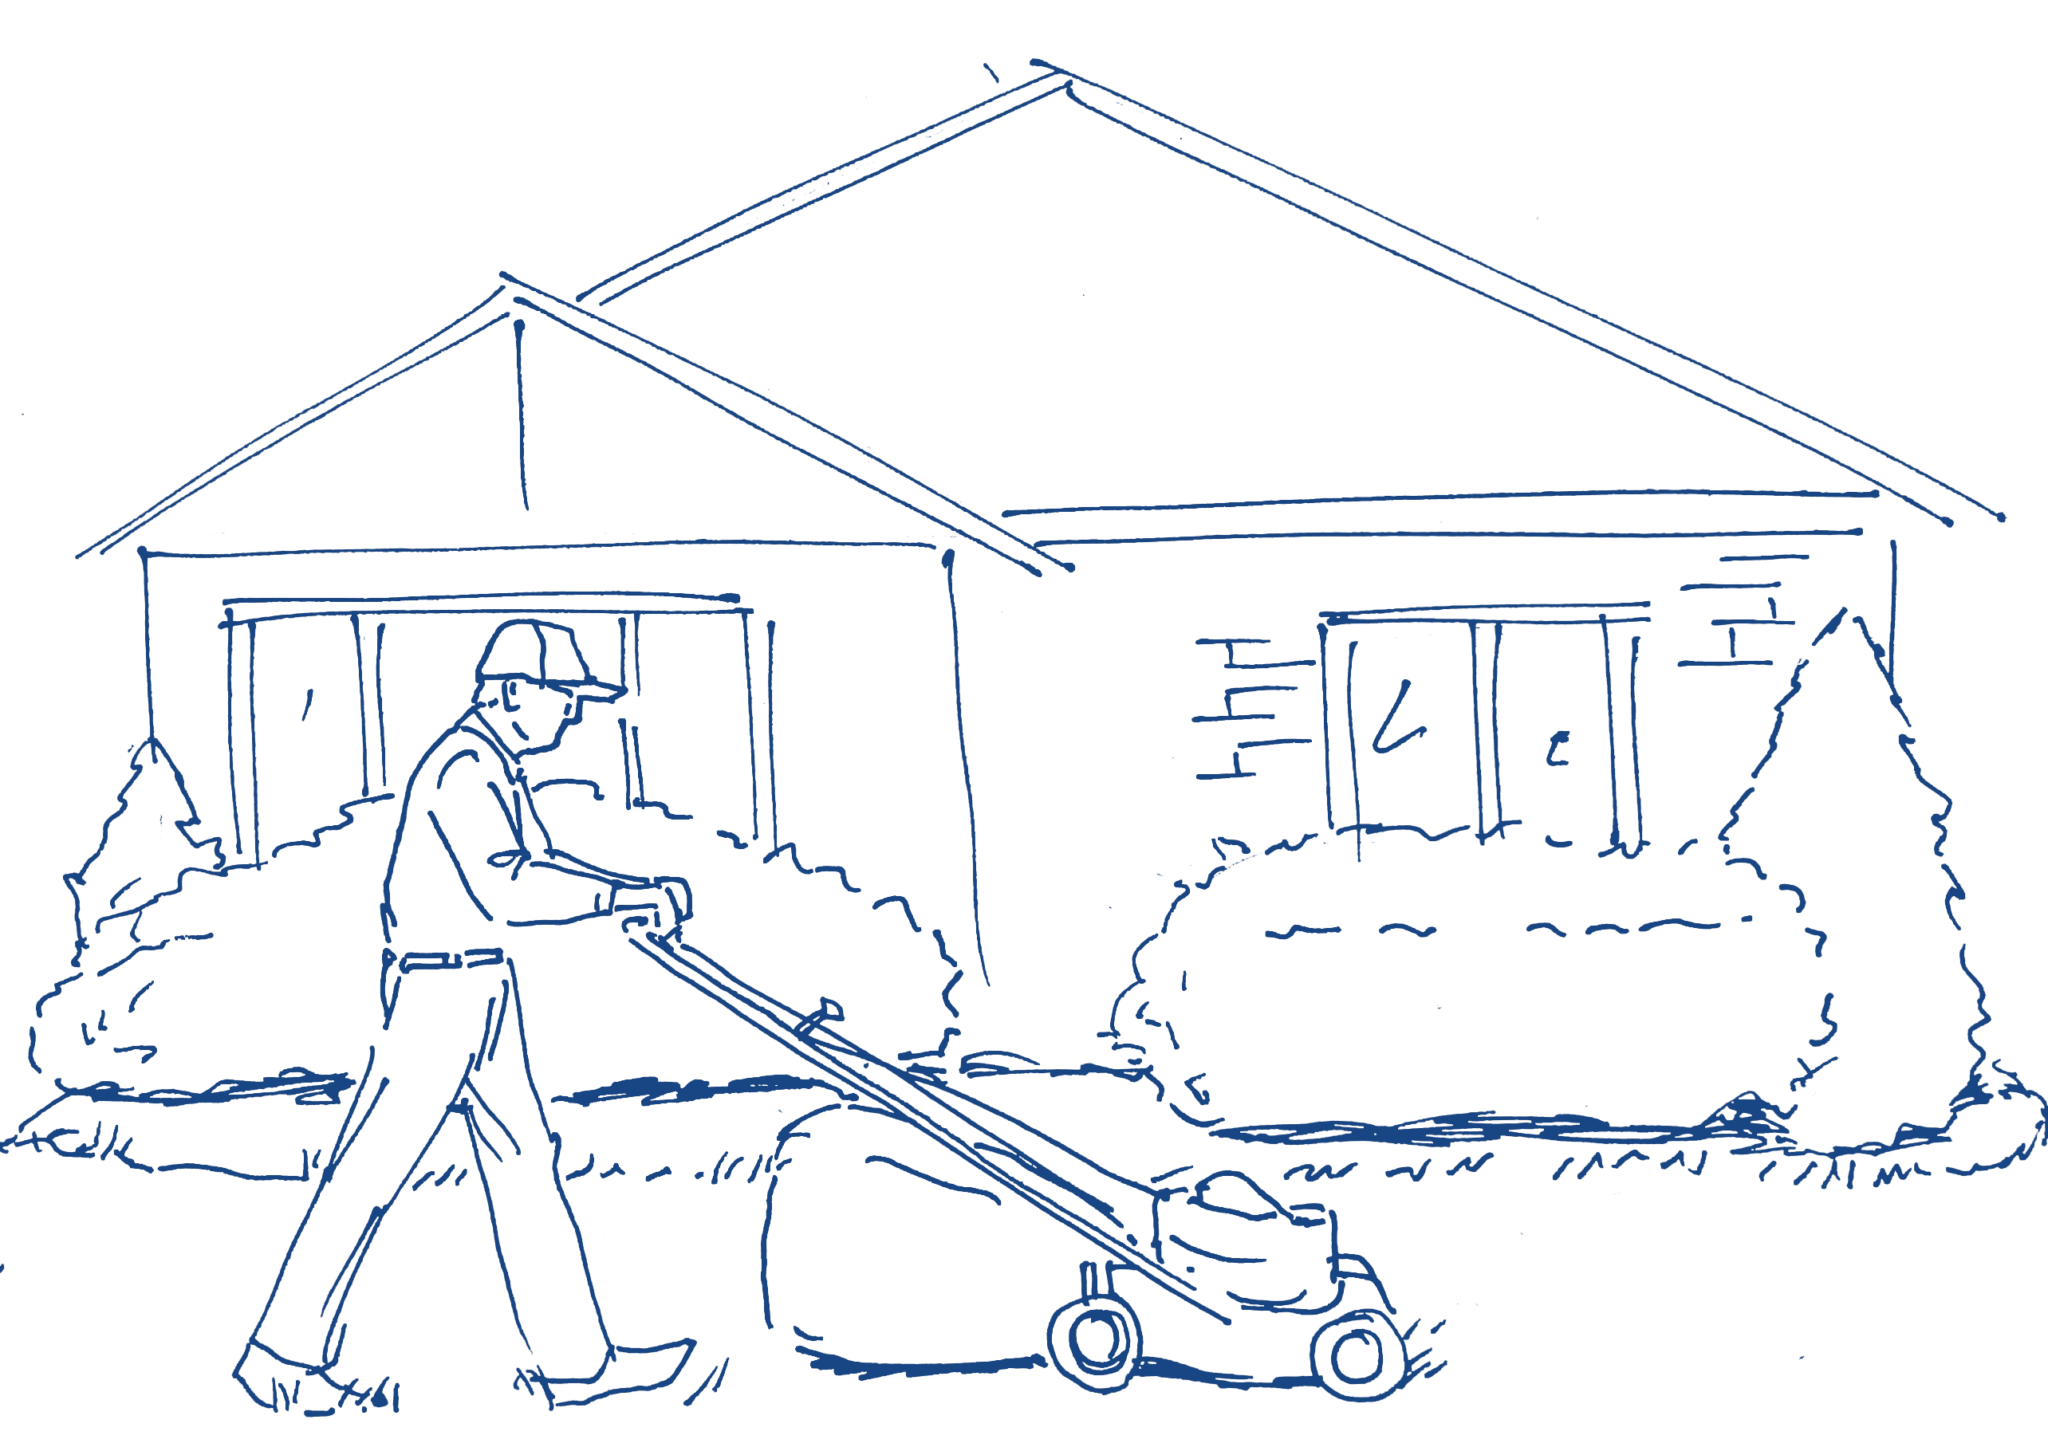
In Dutchess, housing development has traditionally focused on single-family homes on individual lots. Our current housing inventory reflects that history: more than 60 percent of the county’s housing stock consists of detached single-family units. While market trends are shifting, we do not expect our housing stock to change dramatically at the county level.
People living in detached single-family homes tend to rely more on personal vehicles for their trips. And much of our housing is in lower-density areas where transit, walking, and bicycling are less convenient or even impossible. Given the prevalence of these lower-density development patterns, we expect the personal vehicle to remain the predominant mode of transportation in the county. However, where denser communities exist or can be developed, promoting other travel options will be essential.
Housing Data for Dutchess County (2009-2023)
| Year | 2009-2013 | 2014-2018 | 2019-2023 |
|---|---|---|---|
| Total Housing Units | 118,551 | 120,472 | 123,576 |
| Occupied Housing Units | 107,830 | 107,347 | 115,184 |
| Owner Occupied | 70% | 69% | 69% |
| Renter Occupied | 30% | 31% | 31% |
| Single-Family Detached | 63% | 65% | 63% |
| Median Mortgage | $2,255 | $2,260 | $2,540 |
| Median Rent | $1,105 | $1,194 | $1,522 |
Source: U.S. Census Bureau, American Community Survey (ACS)
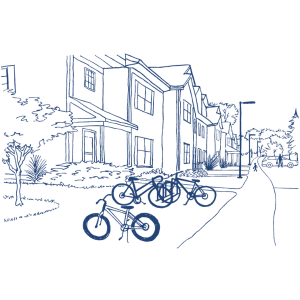
Trend 2. For new housing, more apartments, condos, and townhouses
While detached single-family homes make up much of our housing, new construction continues to shift more towards apartments, condos, and townhouses. A look at projects in the development pipeline shows that these housing types make up more than 80 percent of all proposed residential units in the county. Apartment development has been particularly strong: in recent years, more apartments have been built in Dutchess than one-family homes (detached, townhouses, and condos). And the detached single-family homes that are being built are often on smaller lots.
The low proportion of detached residential projects is largely driven by limited available land and rising construction costs, which makes higher-density development more cost-effective, but also due to demographics (e.g., an aging population).
The growth in attached and smaller-lot housing presents opportunities to expand transportation access in these locations. This could range from traditional transit routes and demand-response services to on demand and micro-mobility options. The growth in denser housing will also make walking and bicycling important considerations.
However, denser development types require adequate water and sewer capacity, as well as supportive zoning codes, which are lacking in many municipalities.
Trend 3. Tight market, rising costs
We will likely continue to see a tight housing market and rising housing costs, driven by several trends. Household sizes are shrinking (i.e., we need more units to simply house our existing population). Our housing supply is inadequate, particularly for lower-income owners and renters. And an increase in higher-income households has put pressure on prices, as they can pay higher rents and outbid others for homes.
The rental market continues to experience very low vacancy rates, even though the number of multi-family units being built has been increasing. Dutchess saw almost 1,750 new apartment units constructed from 2020 to 2024, the highest since the early 1970s. Yet our vacancy rate in 2024 stood around two percent, well below a healthy rate of five percent. These low vacancies have led to higher rents, with average apartment rents increasing by almost 30 percent from 2019 to 2024.
For the owner market, median home prices in Dutchess County have increased by a remarkable 60 percent in the past decade. Though home prices have started to ease, the cost of housing continues to rise faster than wages, and mortgage costs have increased due to higher interest rates. High interest rates also make would-be sellers reluctant to give up low-rate mortgages, further limiting supply.
The tight housing market may change if more housing is built and inventory increases, and as older residents transition out of single-family homes. In either case, it is likely that housing development will be focused in or adjacent to existing neighborhoods, so we will need to invest in the transportation networks that serve those areas.
Construction of Single Family Homes vs Apartments (rolling 3 year average)
Source: Dutchess County Planning
Single-Family Home Median Lot Sizes (6-year rolling median, by year built)
Source: Dutchess County Planning
Median Home Prices in Dutchess County
Source: Dutchess County Planning
Trend 4. Lack of housing options for low- and moderate-income renters and buyers
As housing costs increase for buyers and renters, we run the risk of pricing out low- and moderate-income households. An overly competitive housing market will invariably favor wealthier households, especially those who have the means to own rather than rent.
In Dutchess, homeowners tend to spend less of their income on housing than renters: about 32 percent of homeowners with a mortgage spend more than 30 percent of their income on housing, which is considered ‘cost burdened’. By contrast, more than half of renter households are cost burdened.
Though rising housing costs place additional financial burdens on buyers and renters, renters feel a disproportionate impact. This will require us to pay close attention to transportation options in areas with a high share of renters (particularly the City of Poughkeepsie, where more than 60 percent of residents rent) and to minimize transportation costs for renter households. Reducing transportation costs can also help low- and moderate-income home buyers, by enabling them to compete in a competitive real estate market.
Again, this will require us to maintain and expand low-cost transportation choices in established neighborhoods, since it’s these locations that may be the most affordable to local buyers. We can also support the development of other housing options such as duplexes, fourplexes, cottages, and townhouses in walkable town and village centers.
In Dutchess County, 17% of renter households do not have access to a vehicle, compared to only 3% of owner-occupied households.
Dutchess County Households with a Housing Cost Burden*
| 2009-2013 | 2014-2018 | 2019-2023 | |
|---|---|---|---|
| Homewoners with a mortgage | 43% | 37% | 32% |
| Renters | 54% | 55% | 52% |
Source: U.S. Census Bureau, American Community Survey (ACS) * Housing cost burden defined as 30 percent or more of income used to pay a mortgage or rent.
Our Role
Based on what we’ve learned about housing, our role could include the following:
- Support low-cost transportation choices such as walking, bicycling, and transit to help low- and moderate-income households, especially in established neighborhoods and locations with high shares of renters and new homeowners.
- Encourage infill development in our cities, villages, and town centers, especially of apartments, townhouses, condos and other attached housing types, to capitalize on existing transportation infrastructure and services.
- Support work by County Planning and municipalities to reform zoning codes and invest in water and sewer capacity to support walkable, transit-supportive development.